 http://www.rba.gov.au/publications/bulletin/2008/feb/images/aug-twi-aus-dol-graph4.gif
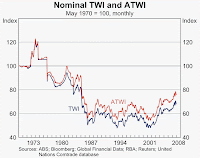
A Bilateral Graph is a graph that represents more than one variable. A Bilateral Graph can be portrayed by many different types of graphs, from line graphs to bar graphs. In this Bilateral Graph, the two variables that are being compared are the Nominal TWI and ATWI are represented by a red and blue line.
No comments:
Post a Comment