 http://www.lib.utexas.edu/maps/texas/combtrk_tx_1998.jpg
Saturday, April 17, 2010
Flow Maps
http://www.lib.utexas.edu/maps/texas/combtrk_tx_1998.jpg
Star Plot
 http://upload.wikimedia.org/wikipedia/commons/0/09/MER_Star_Plot.gif
A Star Plot is used to portray data. Each star represents a specific value. A Star Plot is used to portray a large group of data and is created with a specific design in order to portray that information. Each distance of the stars and radius represents a specific value.
Proportional Circle Maps
 http://propagandica.files.wordpress.com/2008/11/circlesizeisproportionaltotheamounteachcountysleadingcandidateisahead.jpg
A Proportional Circle Map portrays data with the use of circles. The circles, which can be in different sizes, show information about a specific data group. This map represents the amount of propaganda Obama and McCain had on specific areas. From this map, you can tell that Obama focused in states in the north, south, and west, while McCain focused his propaganda in states in the middle of the country.
Isobar Map
 http://www.newmediastudio.org/DataDiscovery/Hurr_ED_Center/Hurr_Structure_Energetics/Closed_Isobars/Closed_Isobars_fig02.jpg
An Isobar map is a type of Contour map. An Isobar map uses isobar lines, a form of contour lines, to represent points of equal pressure. This map is often used in Meteorology.
Isotach Map
 http://www4.ncsu.edu/~nwsfo/storage/cases/20030123/small.eta_12z_300_000hr.gif
An Isotach map is a type of a contour map. An Isotach map is used to show equal points of wind sped in an area, using isotach lines, which are a form of contour lines.
Isohyetal Map
 http://www.bom.gov.au/hydro/wr/unesco/friend/pioneer/pione22.gif
An Isohyetal map is another type of Contour map. An Isohyetal map uses isohyets, a form of contour lines to represent equal points of precipitation of an area.
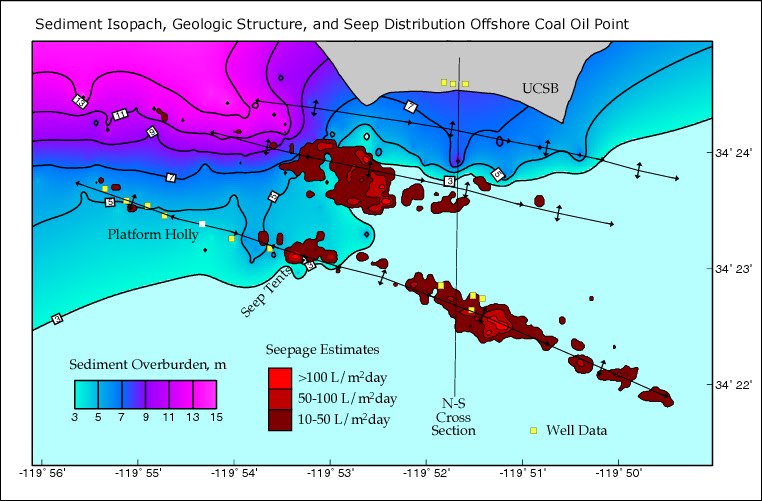
Isopach
 http://seeps.geol.ucsb.edu/images/pictures/geology_images/isopach.jpg
An Isopach map is a type of a contour map. An Isopach map uses isopach lines, a form of contour lines to represent the thickness of an area. These maps are often used in geology.
Subscribe to:
Posts (Atom)